How to USE Moving Average Convergence Divergence (MACD) in Cryptocurrency Trading
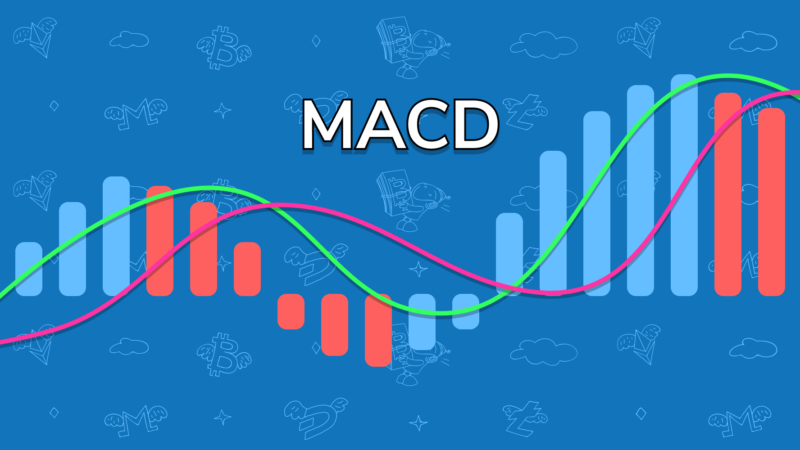
Moving Average Convergence Divergence (MACD) is a technical trading indicator from the momentum class available for free on most trading platforms. The main aim of this indicator is to see the market momentum and divergence. https://mommabe.com
Basics of MACD
Geral Appel created MACD in the late 1970s to identify the change in price direction, strength, and momentum. Here the basic formula is to calculate the change in two difference EMA’s:
MACD= Exponential Moving Average (26 Period)- Exponential Moving Average (12 Period)
In this calculation, Exponential Moving Average is used instead of Simple Moving Average. EMA is the exponentially weighted moving average because it focuses on the most recent price data. On the other hand, the Simple Moving Average focuses on the average price data of the last number of candles. Therefore, when we try to anticipate the price using a lower-valued moving average, EMA provides the most reliable result than the SMA.
In MACD, EMA 26 and 12 are considered signal lines, and a horizontal zero level is the base line. Moreover, there is a Histogram above or below the baseline that shows the market sentiment. Let’s see a visual representation of MACD from the forex chart.
MACD Elements
In MACD, the most crucial element is Histogram. Traders usually calculate the Histogram’s behavior with EMA’s to understand the market sentiment.
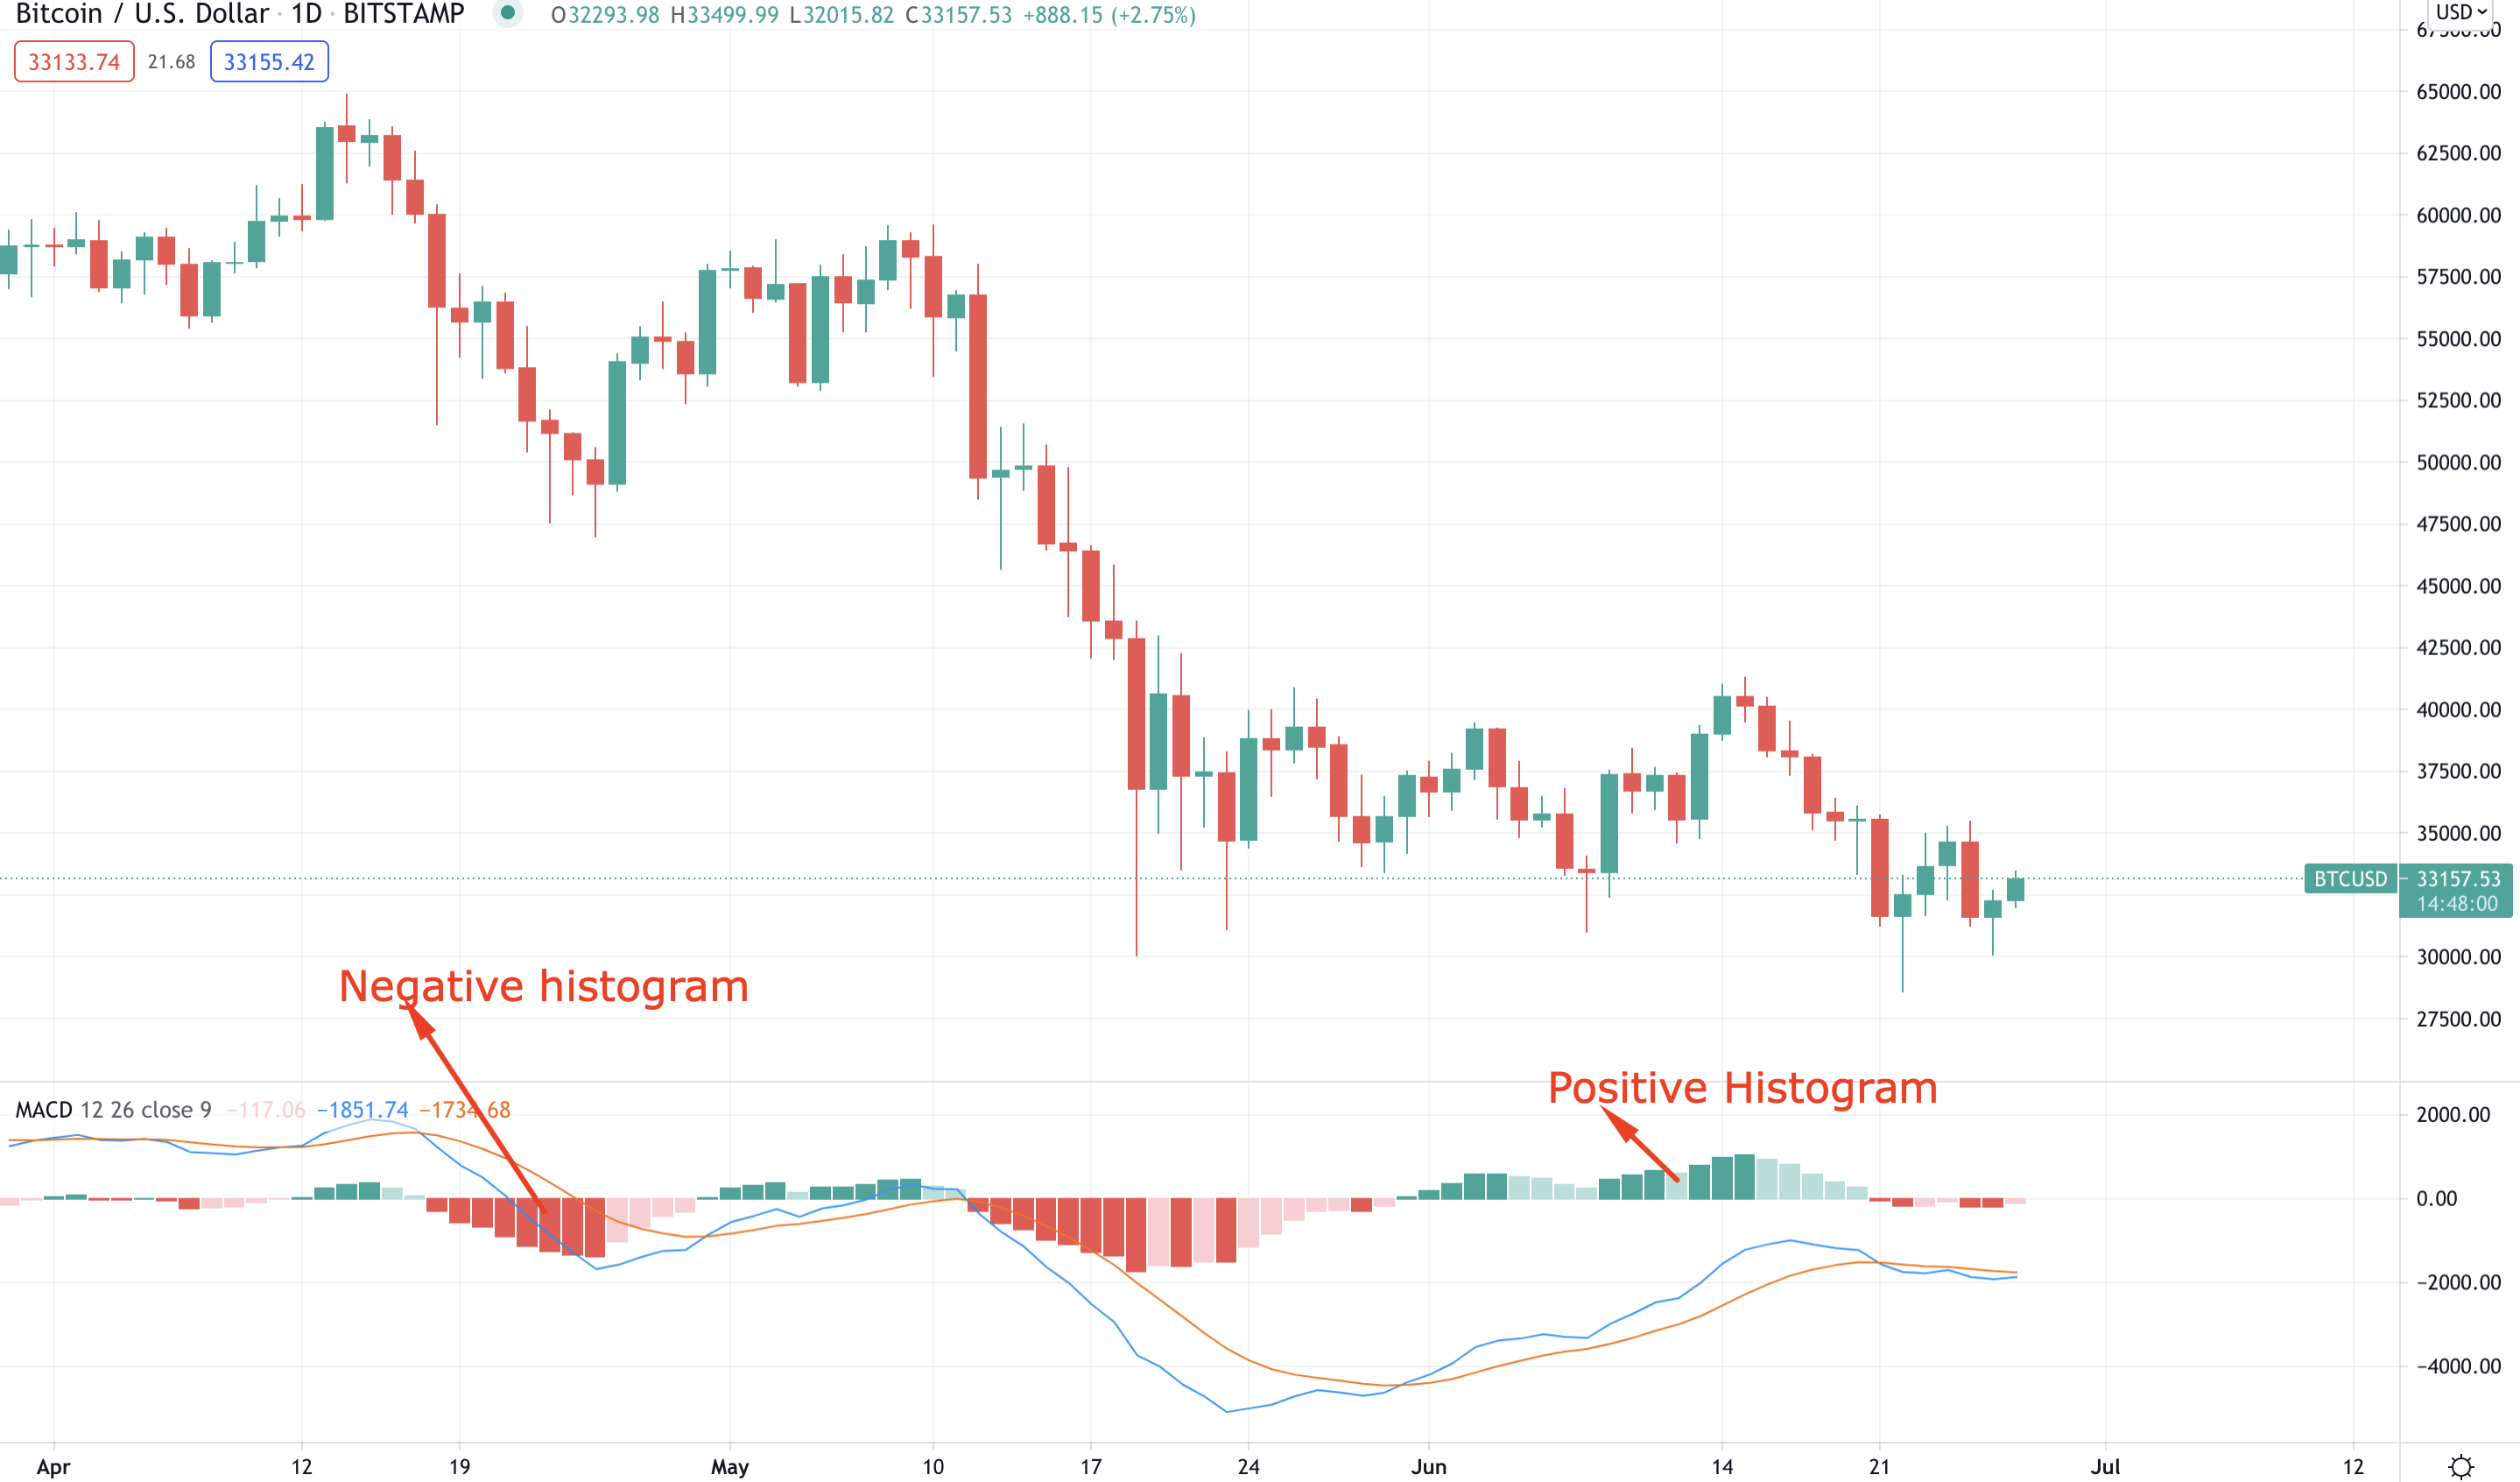
MACD Histogram
MACD Histogram is vertical lines that appear above and below the baseline. The Histogram closes with a candle, and when a new candle opens, a new Histogram appears. Let’s see how to read the price with the MACD Histograms:
- If the Histogram is above the baseline, the market sentiment is bullish, and if the Histogram moves below the zero lines, the market sentiment will be bearish.
- Any higher High from the positive Histogram is a sign that buying pressure is increasing in the price.
- Any lower low in Negative histogram is a sign that selling pressure is increasing in the price.
- PNP (Positive-negative-positive) formation indicates sellers’ failure in the price.
- NPN (Negative-positive-negative) formation indicates buyers failure in the price
- If the Histogram swings do not match the price, it will indicate a Hidden Divergence. It is a sign that the price needs some correction, and it will continue the current trend after it.
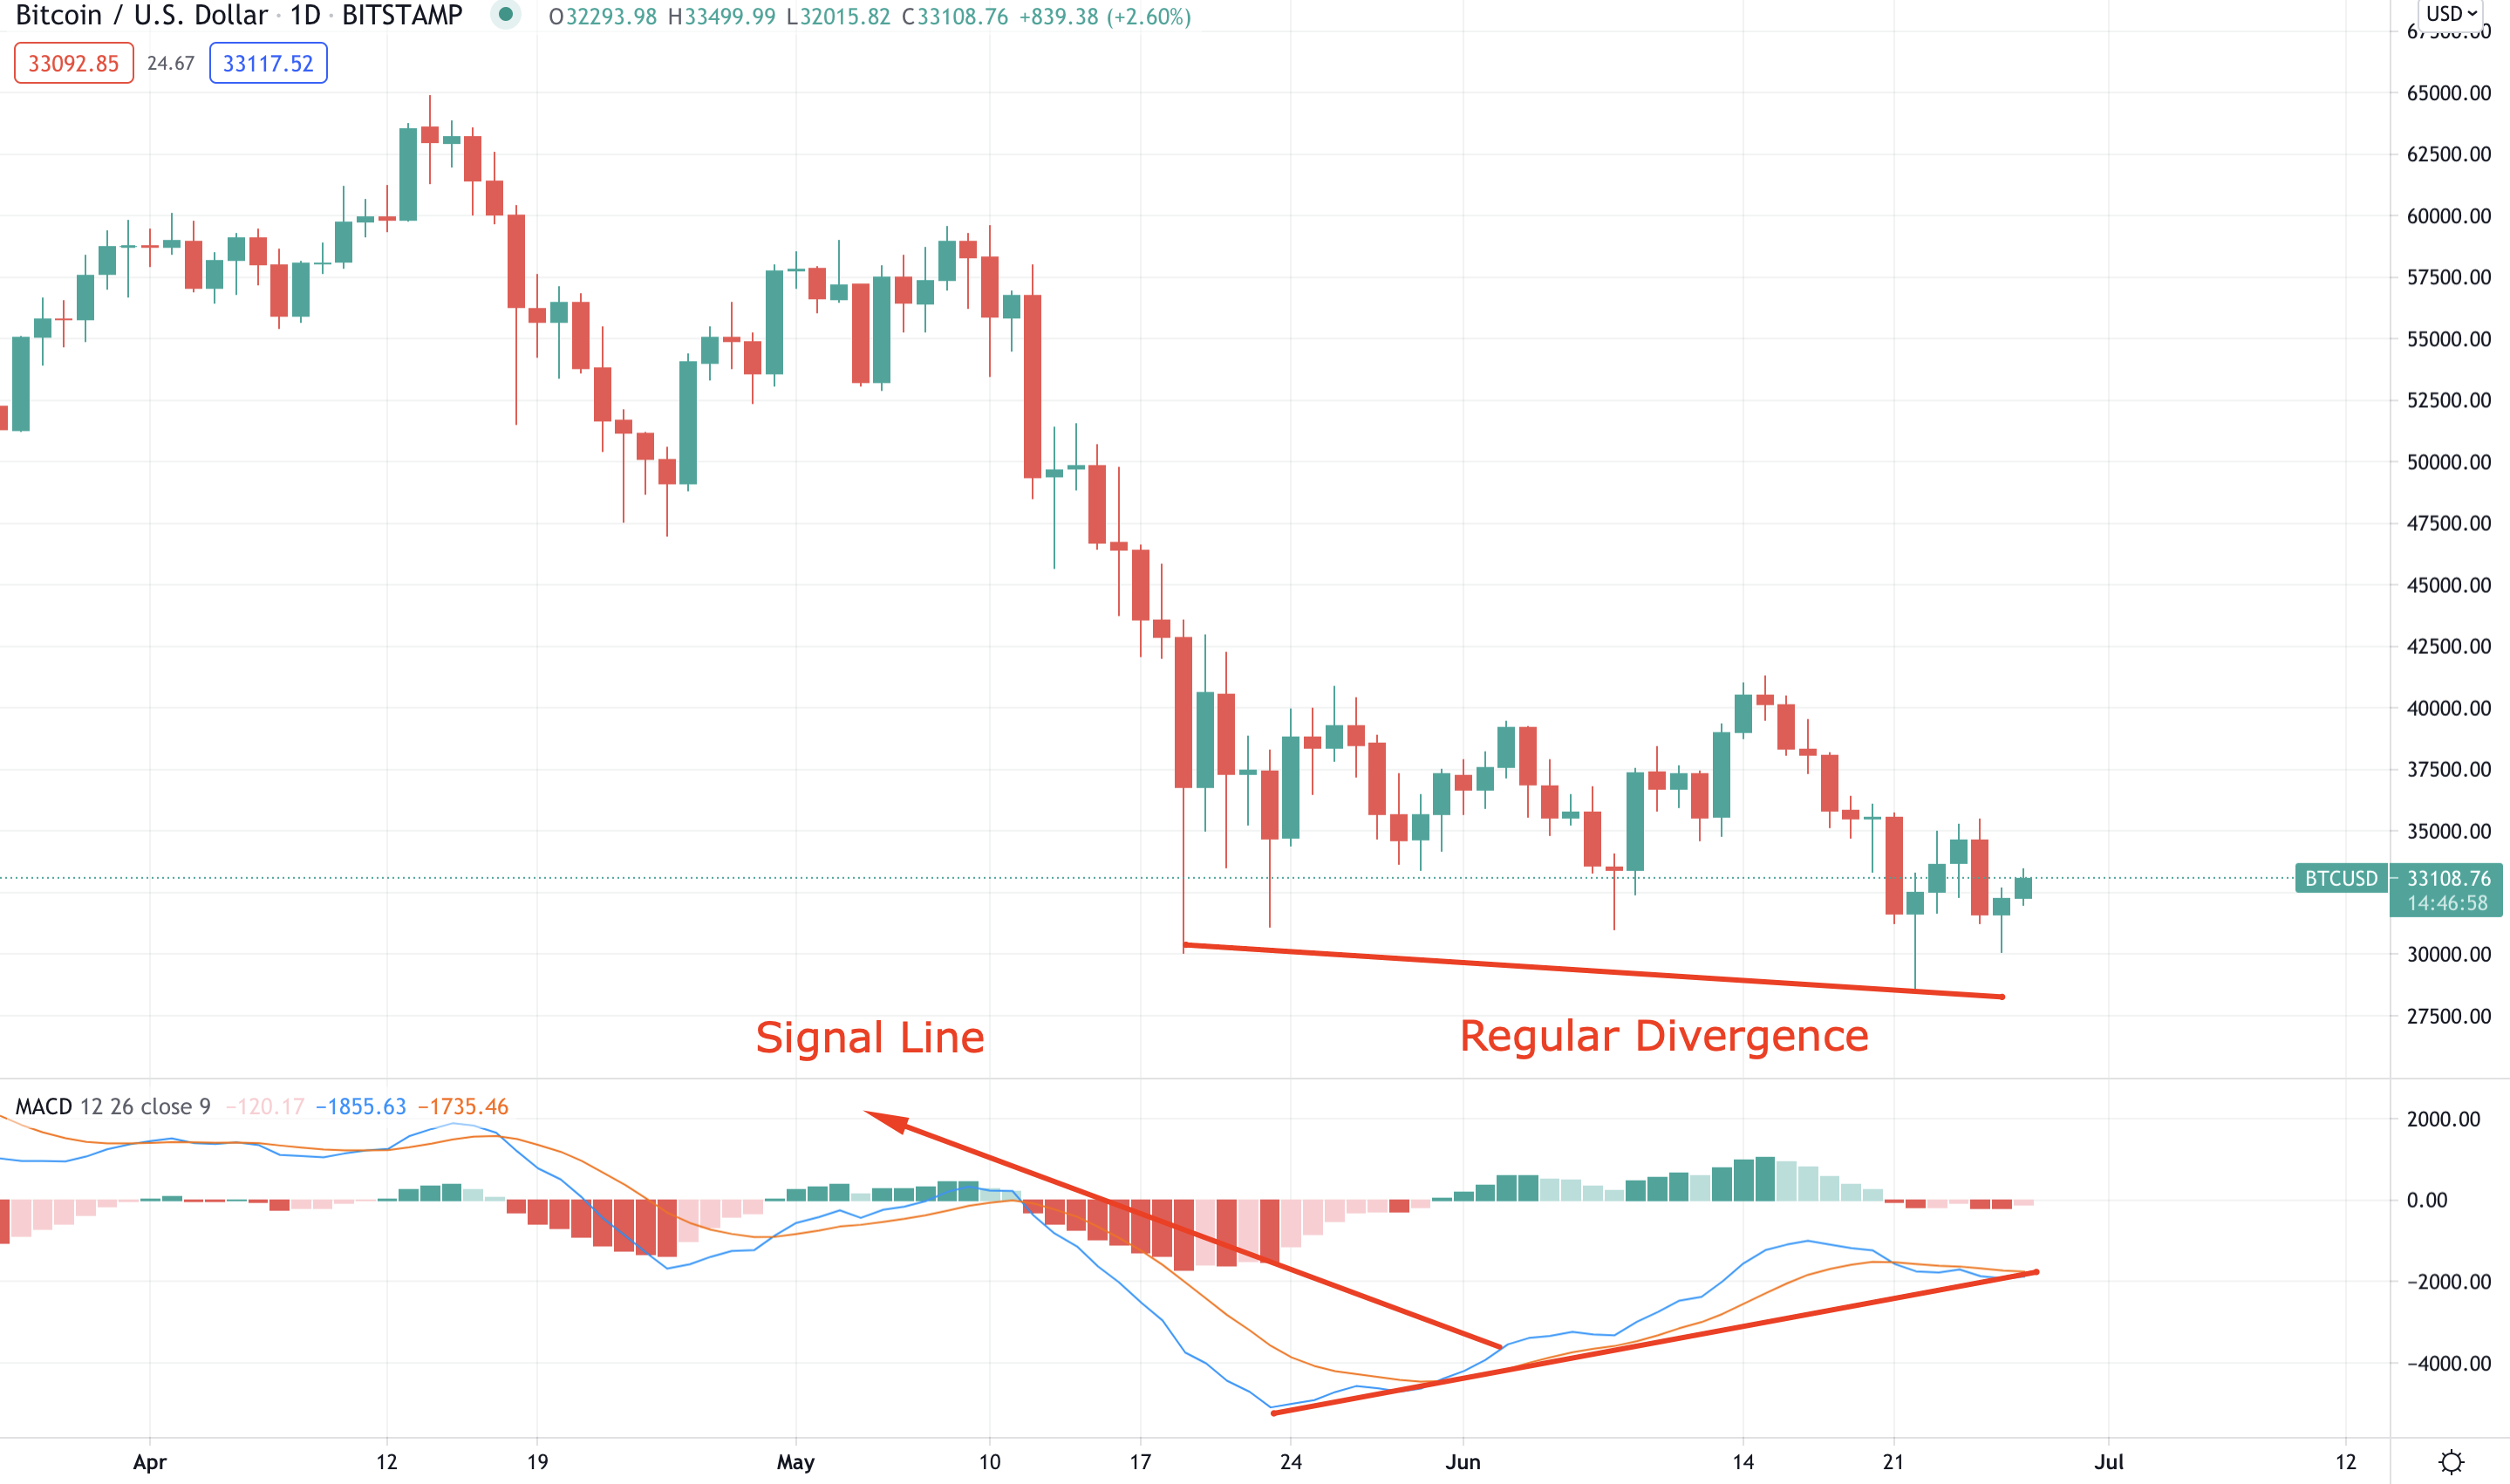
MACD Signal Lines
In MACD, two EMA’s with different values are used that are known as signal lines. Traders can identify the possible price movement using the Signal line and baseline:
- If the Signal line is above the baseline and positive Histogram, the price is within a solid bullish trend.
- If the Signal line is below the baseline and negative Histogram, the price is within a definite bearish trend.
- If the Signal Line swings do not match the price, it will indicate a regular Divergence. The regular divergence from a significant price level works as a significant price reversal point.
Final Thoughts
MACD is a profitable trading indicator, but it often provides false signals as it is a lagging indicator. Therefore, traders should use other tools like indicators, candlesticks, or price levels to increase the trade’s probability.
Leave a Reply
Latest News


More from GCR

Featured GCR Announcement GCR Exclusive GCR Quarterly Review
GCR Market and Investment Trends ...
By Global Coin Research Team Highlights GCR is a research and investment community. As a collective, we source investments, conduct research and diligence, and make ...

The Landscape of Crypto Intents
Introduction The current blockchain paradigm requires users to devise a specific series of transactions to achieve a desired outcome. However, crafting transactions can be complicated. ...

Near AI x HZN – ...
In our last article, we outlined Near’s vision to become the hub for User-Owned AI and the steps that it is taking to develop an ...