Mapping The Web3 Data Landscape

This piece was originally published on Decentralised.co. We at GCR will bring to you long forms from Decentralised twice every Month – every alternate Thursday! Decentralised.co is trusted by management at over 200 firms to stay updated on the trends, data and insights that matter. Sign up for their newsletter below—more on this collaboration for our most active members on Discord.
Hey there,
We had written a pre-cursor to this piece on July 18th if you’d like context that goes beyond what’s written here.
All living things keep some record. Animals track seasons to understand when to hunt. Rodents and birds store food in unique places. They need to remember where they stored it when accessing it for sustenance months later. Wolves create marks around the perimeter of their territory to signal other animals to keep out. Even trees keep track of time. Every year, a ring is formed in trunks. One can estimate a tree’s age based on the number of rings.
Although trees and animals keep track of time, they cannot retrieve or narrate the past. They don’t have access to memory. It is what makes human recordkeeping different. Thanks to our communication abilities, we know that Sumerians in Mesopotamia (3400 BCE) and ancient Egyptians (3200 BCE) used cuneiform writing and hieroglyphics to record information.
Humanity evolved when knowledge could be passed on without requiring the source to be physically involved. We read and enjoy the works of Plato or Socrates long after they are gone because we have the means to store their teachings. Writing was the original AR platform.
 Pictographic tablet featuring an account of 33 measures of oil, from Godin Tepe, Iran (Courtesy Dr. T. Cuyler Young, Royal Ontario Museum, Toronto)")
Where writing left things to the imagination, data helped keep things objective. It reduced the requirement for individuals to store things in their memory. This is partly why some of the oldest human texts involve debt, income, or trade records.
Going Digital
In the post-industrial age, firms built competitive moats to strengthen their market position by going digital with their sales records. One example of this is an Indian company called Asian Paints. Their paint might not be the best in the market, but they control a 50%+ market share of India’s $8 billion paint industry.
Why? The easy answer is that it is a household brand, and the company has economies of scale. But how they got there has roots in data. They invested heavily in data collection and processing to optimize their supply chain.
For context, the Asian Paints stock has had a staggering CAGR of 25% over the last 30 years. Backing that growth was an investment in a mainframe computer in the 1970s. The device was more powerful than the ones used at the best research organisations in India at the time. It collected hourly data about the colour and quantity of paint sold across India. This allowed Asian Paints to build a model that predicts paint demand throughout India with 98% accuracy.
This predictive power allowed Asian Paints to capture maximum value, as it could drastically reduce its replenishment time. At the time, the norm for selling goods like paints was to sell it to a wholesaler, who then gave it to a distributor, who would, in turn, sell it to a dealer. The dealer would interact directly with the consumer. The reason for such a complex supply chain was that each party held an inventory of assets and controlled data on the supply and demand for paint.
Mr Choksey – the founder of Asian paints, removed wholesalers and distributors from the supply chain by studying the consumption patterns of the end user and reducing reliance on the middlemen. Through removing the middlemen, Asian Paints captured 97% of the MRP (3% to dealers) compared to the 60% captured by their competitors.

The transition to digital did not happen overnight. Part of what made data collection interesting was the world of finance and how interconnected it had slowly become. For instance, in the late 20th century, stock market data was relayed over the telegraph using devices like the one above. As early as 1835, traders would train pigeons to carry bits of paper with information about what was happening in Europe. When steamboats carrying goods came within 50 miles of land, the pigeons would fly to designated spots with the information. Traders used to pay up to $500 for each hour in advance they could get the news.
By 1867, traders began competing to optimise how fast information was relayed through the telegraph. A Western Union Employee named E. A Calahan paid over $200k to the NYSE for the ability to send employees on their trading floor to relay ticker data to his clients. One of the individuals working diligently on optimising the system was a young scientist named Thomas Alva Edison. A century later, tools like the Bloomberg terminal would exponentially scale the pace and amount of financial data relayed on any given day.
Moulding Raw Data
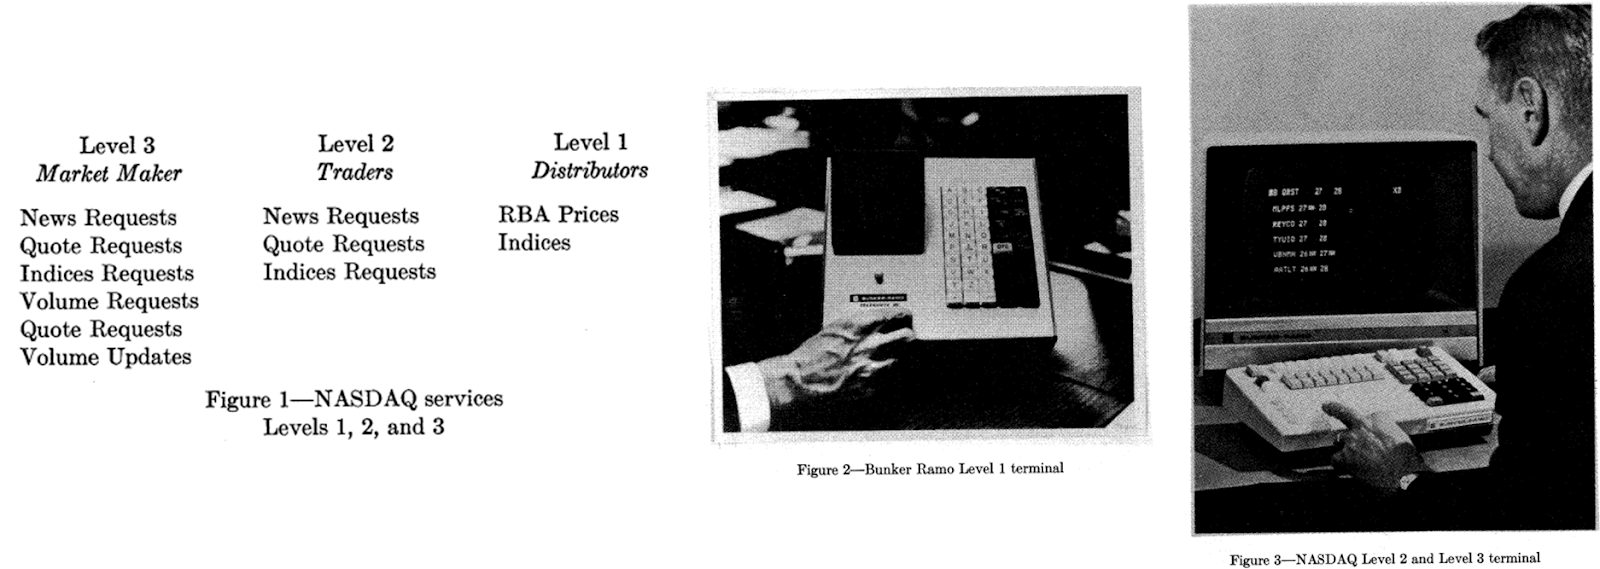
Data, like crude oil, has to undergo several steps of refinement before it can be used. Learning how Bloomberg grew sheds light on how the whole data landscape evolved and which process. Bloomberg was not the first attempt to use technology to improve trading and reporting mechanisms. NASDAQ used Bunker Ramo terminals to disseminate information and place bid/ask orders. However, relying on erstwhile telephone communication networks meant that scaling this model would always be challenging.
In 1981, Michael Bloomberg, a partner at the investment bank Solomon Brothers, got fired with $10 million for his equity when Phibro Corporation acquired the bank. He realised that investors are ready to pay for streamlined financial information with the growing electronification of financial markets from New York to Japan. He started a data services company called Innovative Market System, which was rechristened to Bloomberg in 1986.
Before the internet took off, the Bloomberg Terminal was accessed using The Chiclet. This was connected to the Bloomberg controller via a special cable connected to the local hub via dedicated telephone lines. Bloomberg collected data via data partnerships, news agencies and press releases, proprietary methods like manual data entry and phone-based data collection.

With the internet, the information floodgates opened. Today, Bloomberg procures, processes, and delivers 200 billion pieces of financial information in almost real-time. That is approximately 23 million data points per second. Some of the information available on Bloomberg is public. Data points like companies’ financial statements and stock and bond prices can be found on public forums.
But what if you are an oil and gas analyst and want to understand the movement of crude oil containers? You are unlikely to get this information in real-time if you don’t subscribe to a data source like Bloomberg. Not all the data on the internet is freely available.
There are typically two constraints for individuals when it comes to data in Web2: permissioned access and a high barrier to processing large amounts of data. Over the years, providers like Bloomberg have built strong enough network effects to source data through their affiliates, which analysts or investors cannot afford to do.
It is better to pay $20,000 to Bloomberg for an annual subscription than to try to source the data from a mix of data platforms that may each have varying pricing tiers. Even if you grind hard enough to get your hands on the data, you cannot process and run analytics in real time without significant infrastructure spending. On the retail end, many platforms that eventually scaled – were data-matching engines.
Think of it this way: Google (the search engine) is a data company that offers businesses access to users in exchange for ad dollars. When a restaurant or a newsletter (like ours) wishes to target users searching for information on Google, they match supply and demand for similar information. Somebody searching for information on a newsletter specific to Web3 is looking for us. And we are looking for that person. (I am resisting the urge to plug our referral programme here.)
Google built a monopoly due to the economy of scale it functions in. Their inventory of users and the number of queries their users make each day remain unrivaled. Google built that position by launching a search engine that had no ads at a time when advertisements were the norm, then through acquiring YouTube and Android, and eventually, through paying peers like Apple to make Google the default search engine. For Apple alone, Google pays $20 billion a year to remain the default search engine on Safari.
Google pays that premium because, at its core, its offering is a matching engine. The matching engine puts users with a need in touch with businesses that have an offering. Most of the web’s monopolies are, at their core, matching engines. Amazon matches product sellers with buyers. Instagram matches an audience with creators. These matching engines work because interactions on these products leave rich trails from which context can be driven.
Ben Evans famously wrote in 2022 that there is no such thing as data. Knowing my content, food, or travel preferences is not worth much to a third party. It becomes valuable – for commerce or research – only when it is aggregated or enriched with context.
Context in the sense that my preferences for eating biriyani on a Friday night could be used to advertise biriyani delivery to me precisely when the probability of me buying it is the highest. In the aggregate, comparing the probability of my purchasing with a peer in the same region helps target users better.
Data needs either scale (in large numbers) or context to be valuable. Where Web3 and Web2 products have historically differed is in the trails they leave. Only Amazon knows how many Xbox controllers would sell in a given week. But you can see the patterns in which traders buy or sell NFTs on OpenSea on any day. The reason is that each of those transactions leaves a public trail.
Data products in Web3 use those trails to build context.
Blockchains like Ethereum and Bitcoin produce blocks every 12 seconds and ~10 minutes, respectively. Every block contains transactions that change the state of the blockchain. Block explorers like Etherscan capture data related to all the transactions. For example, if you go to Etherscan and see a block, the image below is what you may see.
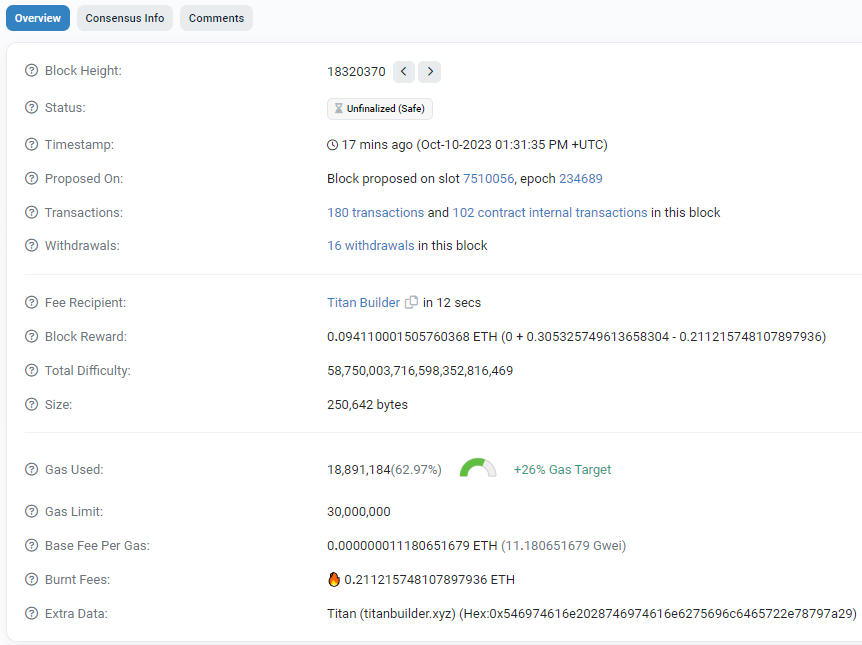
Transactions on the blockchain are rich in context. Products like Arkham and Nansen are interpretation engines for researchers to understand what is going on when a transaction occurs.
You can view all the blocks since Ethereum started. But what can you do with this information? Almost nothing. So, you need a way to capture this data in several tables. For example, whenever an NFT contract of a marketplace gets called in a block, the data related to that transaction should be appended to NFT-related tables, or when a Uniswap contract gets called, the related data should be stored in DEX-related tables. (Dune does this as a service.)
You cannot analyse the raw data without incurring significant infrastructure costs. So, although the data is freely available, you run into the same problems. You rely on external data as an investor or a dApp builder. But your core function is not related to gathering and managing data. Expending resources on essential but non-core activities is not a luxury every organisation can enjoy.
Context Drives Value
For data products, the context around data makes the product unique. Bloomberg applies its financial understanding and transforms data into a form that inventors and traders can easily consume. Websites like Similarweb or research publications like Newzoo use their core competencies to apply social- or gaming-related context to the data they track.
Blockchain native data products differentiate themselves by providing user context through queries that answer questions relevant to specific user subsets. For instance, TokenTerminal computes the economic fundamentals of protocols. Nansen helps market participants label and understand the movement of assets. Parsec queries on-chain data to help traders better analyse DeFi positions.
All of these products run off a public good: on-chain data. The difference is how these products present their data, which makes them appealing to different audiences.
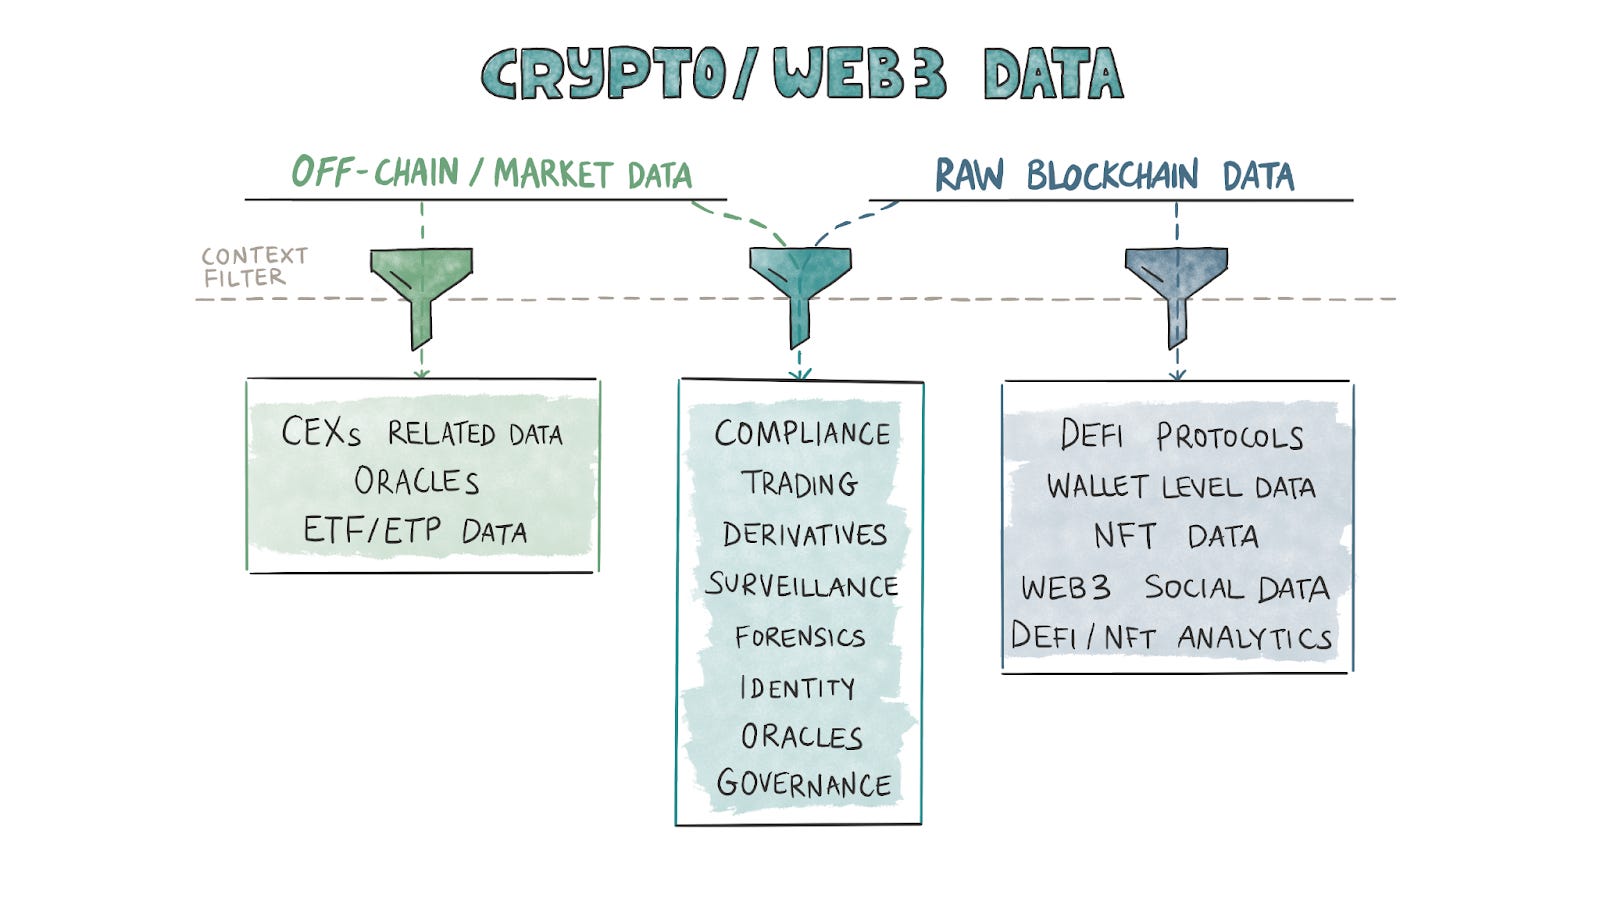
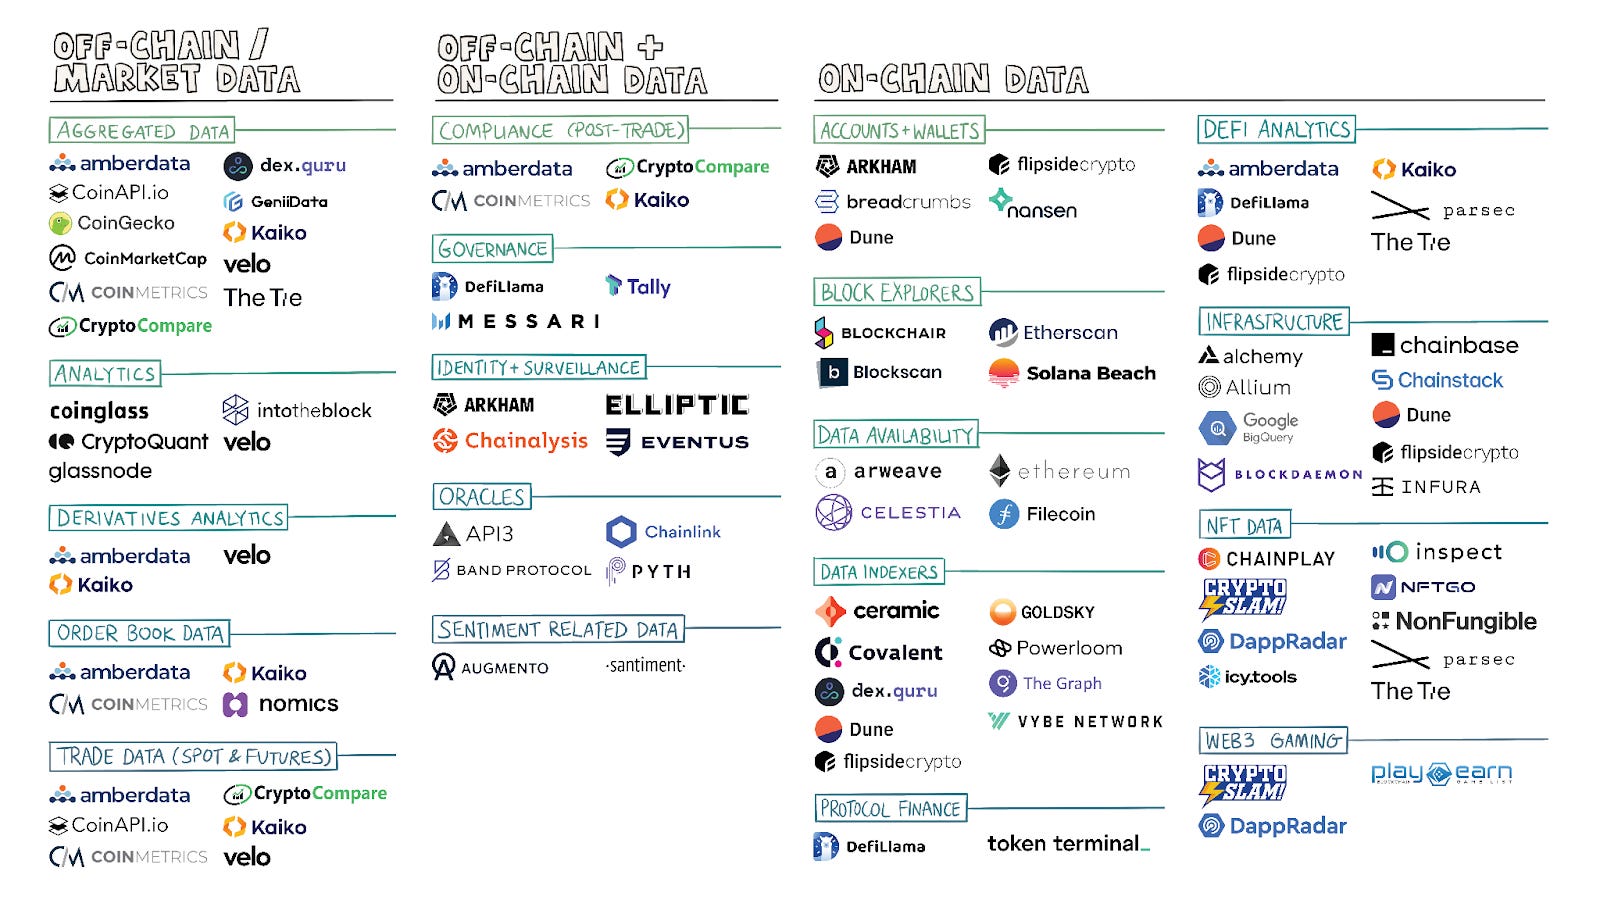
The product category split in our industry is based on what data goes on-chain and what information is derived from off-chain sources. (Some often use both.) Data providers use their context filters to create products. Just as Web2 data has its niches, Web3 data companies have built or are gradually building moats using their core competencies.
As such, the founders’ backgrounds often dictate the nature of the products released. When a core team has spent significant time in capital markets before crypto, their products tend to imitate Bloomberg, whereas crypto native products look like Nansen. Different products cater to different needs, even when querying off the same data.
For instance, exchanges typically discard data after fixed intervals. They are not in the data business, and storing old data demands additional servers and management. Some data providers, like Kaiko and Amberdata, maintain historical order book data from exchanges. Such data allows traders and investors to build models to test their hypotheses. But if you want to understand which DeFi contracts are getting flushed with an inflow of ETH or stablecoins or analyse the on-chain behaviour of specific addresses or entities, you will need a product by Nansen or Arkham.

One way to understand how products have been positioned in the markets is through the lens of consumer personas in crypto. These personas can be classified into the following four key categories.
Financial Institutions
Most dollars flowing through crypto-data products come from financial institutions during a bear market. These are big-ticket customers with longer sales cycles and far more complex data requirements. One way to know if a product is oriented towards financial institutions is if a customer must undergo a sales call to determine how much it costs. In the Web2 world, you cannot find how much PitchBook or CB Insights costs. In crypto, you don’t know what a product like Chainalysis would cost.
Jokes aside, part of the reason for such a sales process is the hands-on, white-glove service offered by data products oriented toward this consumer segment. These users usually opt for highly granular and frequent data. They require data not only for pre-trade decisions but also for post-trade uses to fulfill compliance and taxation requirements.
For example, they need products that tell them what their portfolio value was historically, help them with tax calculations, and so on. Firms like Amberdata, Kaiko, CoinMetrics, CryptoCompare, and, to an extent, Nansen, serve these customers.
In my experience, only founders with backgrounds working in institutions or teams with large funding rounds have been able to crack open the institutional market for data. The barrier to entry is relatively high here, as would be the case with any enterprise product.
Developers
We often come across the composability feature of Web3, which means that Web3 applications can be interdependent. They could require data from one another. So, they constantly need to read data from each other. For example, a platform like Yearn Finance needs to read data from Aave and Compound, and an NFT aggregator like Tensor needs to read data from Magic Eden and other marketplaces.
But this data is stored across blocks on chains like Ethereum and Solana. Ethereum creates a block in 12 seconds, and Solana does it in 400 ms. Sorting blockchain data into tables and storing it for quick access is a non-trivial task. This is where indexers like Covalent, Graph, Chainlink, and Powerloom come into the picture. They ensure that raw blockchain data is stored in a desired format so developers can fetch it via simple API calls.
An emergent segment in this consumer persona involves tools used to understand user behaviour. For instance, ARCx allows developers to map out off-chain data (like browser behaviour) with on-chain data (like wallet addresses) to capture the demographic information of users interacting with a dApp. They are in a relatively small but relevant niche as they help developers identify who their users are.
Researchers and Publications
Data products in crypto often find distribution by collaborating with researchers and publications. CCData, for instance, is often cited on Bloomberg. Researchers are incentivised to lean back on data products as they help save time and effort when collecting, cleaning, or curating data. Products like Dune have built a moat by building a community of analysts who compete with one another to rank higher on their list.
Publications like The Block and Delphi showcase dashboards built using data from third-party providers. Here at Decentralised.co, we rely entirely on external data providers as they help keep the team lean whilst using external resources when collecting data.
The challenge with catering to this consumer segment is that smaller researchers may not have the required budget to justify spending tremendous resources to surface niche insights that may be relevant only to a single person. Conversely, firms are well incentivised to spend effort and resources partnering with significant publications like the Financial Times as it helps with distribution.
Retail investors
Products oriented towards retail investors usually have lower granularity and frequency of data. But they are highly profitable niches to build in as they see economies of scale. Ten thousand users paying $100 each is a $1-million ARR business in a world where churn does not exist. It is easier said than done, but those economics explain why we have so many retail-oriented crypto-data products.
A large chunk of retail-oriented products are free or supported by ads. For example, a free resource like DefiLlama will not tell you how you can route your order via different exchanges (CEXs and DEXs) to avoid slippage as it does not take order book snapshots, but it showcases information about token unlocks or yield unlocks.
One change in this consumer segment is how the delivery medium opens up a new market category—for instance, Cielo delivers data as notifications through Telegram. It has scaled to over 40,000 users by relaying information in an easy-to-consume fashion for a consumer segment that would rather not deal with desktop interfaces. When done right, even distribution mediums can be differentiators for early-stage ventures. Even in data.
Although the classification blurs at points, data firms can be split into B2B or B2C orientations.
Companies like Amberdata and Kaiko have products that cater to sophisticated actors. These products are more granular (details in which the data are available) and frequent (e.g. tick-by-tick and real-time order book data), and they satisfy demands like building and testing models, pre-trade analysis, post-trade reporting, taxation, and compliance. Data is provided in a format that allows customers to carry out proprietary analyses and build visualisations to their tastes. These companies typically offer their products behind a paywall.
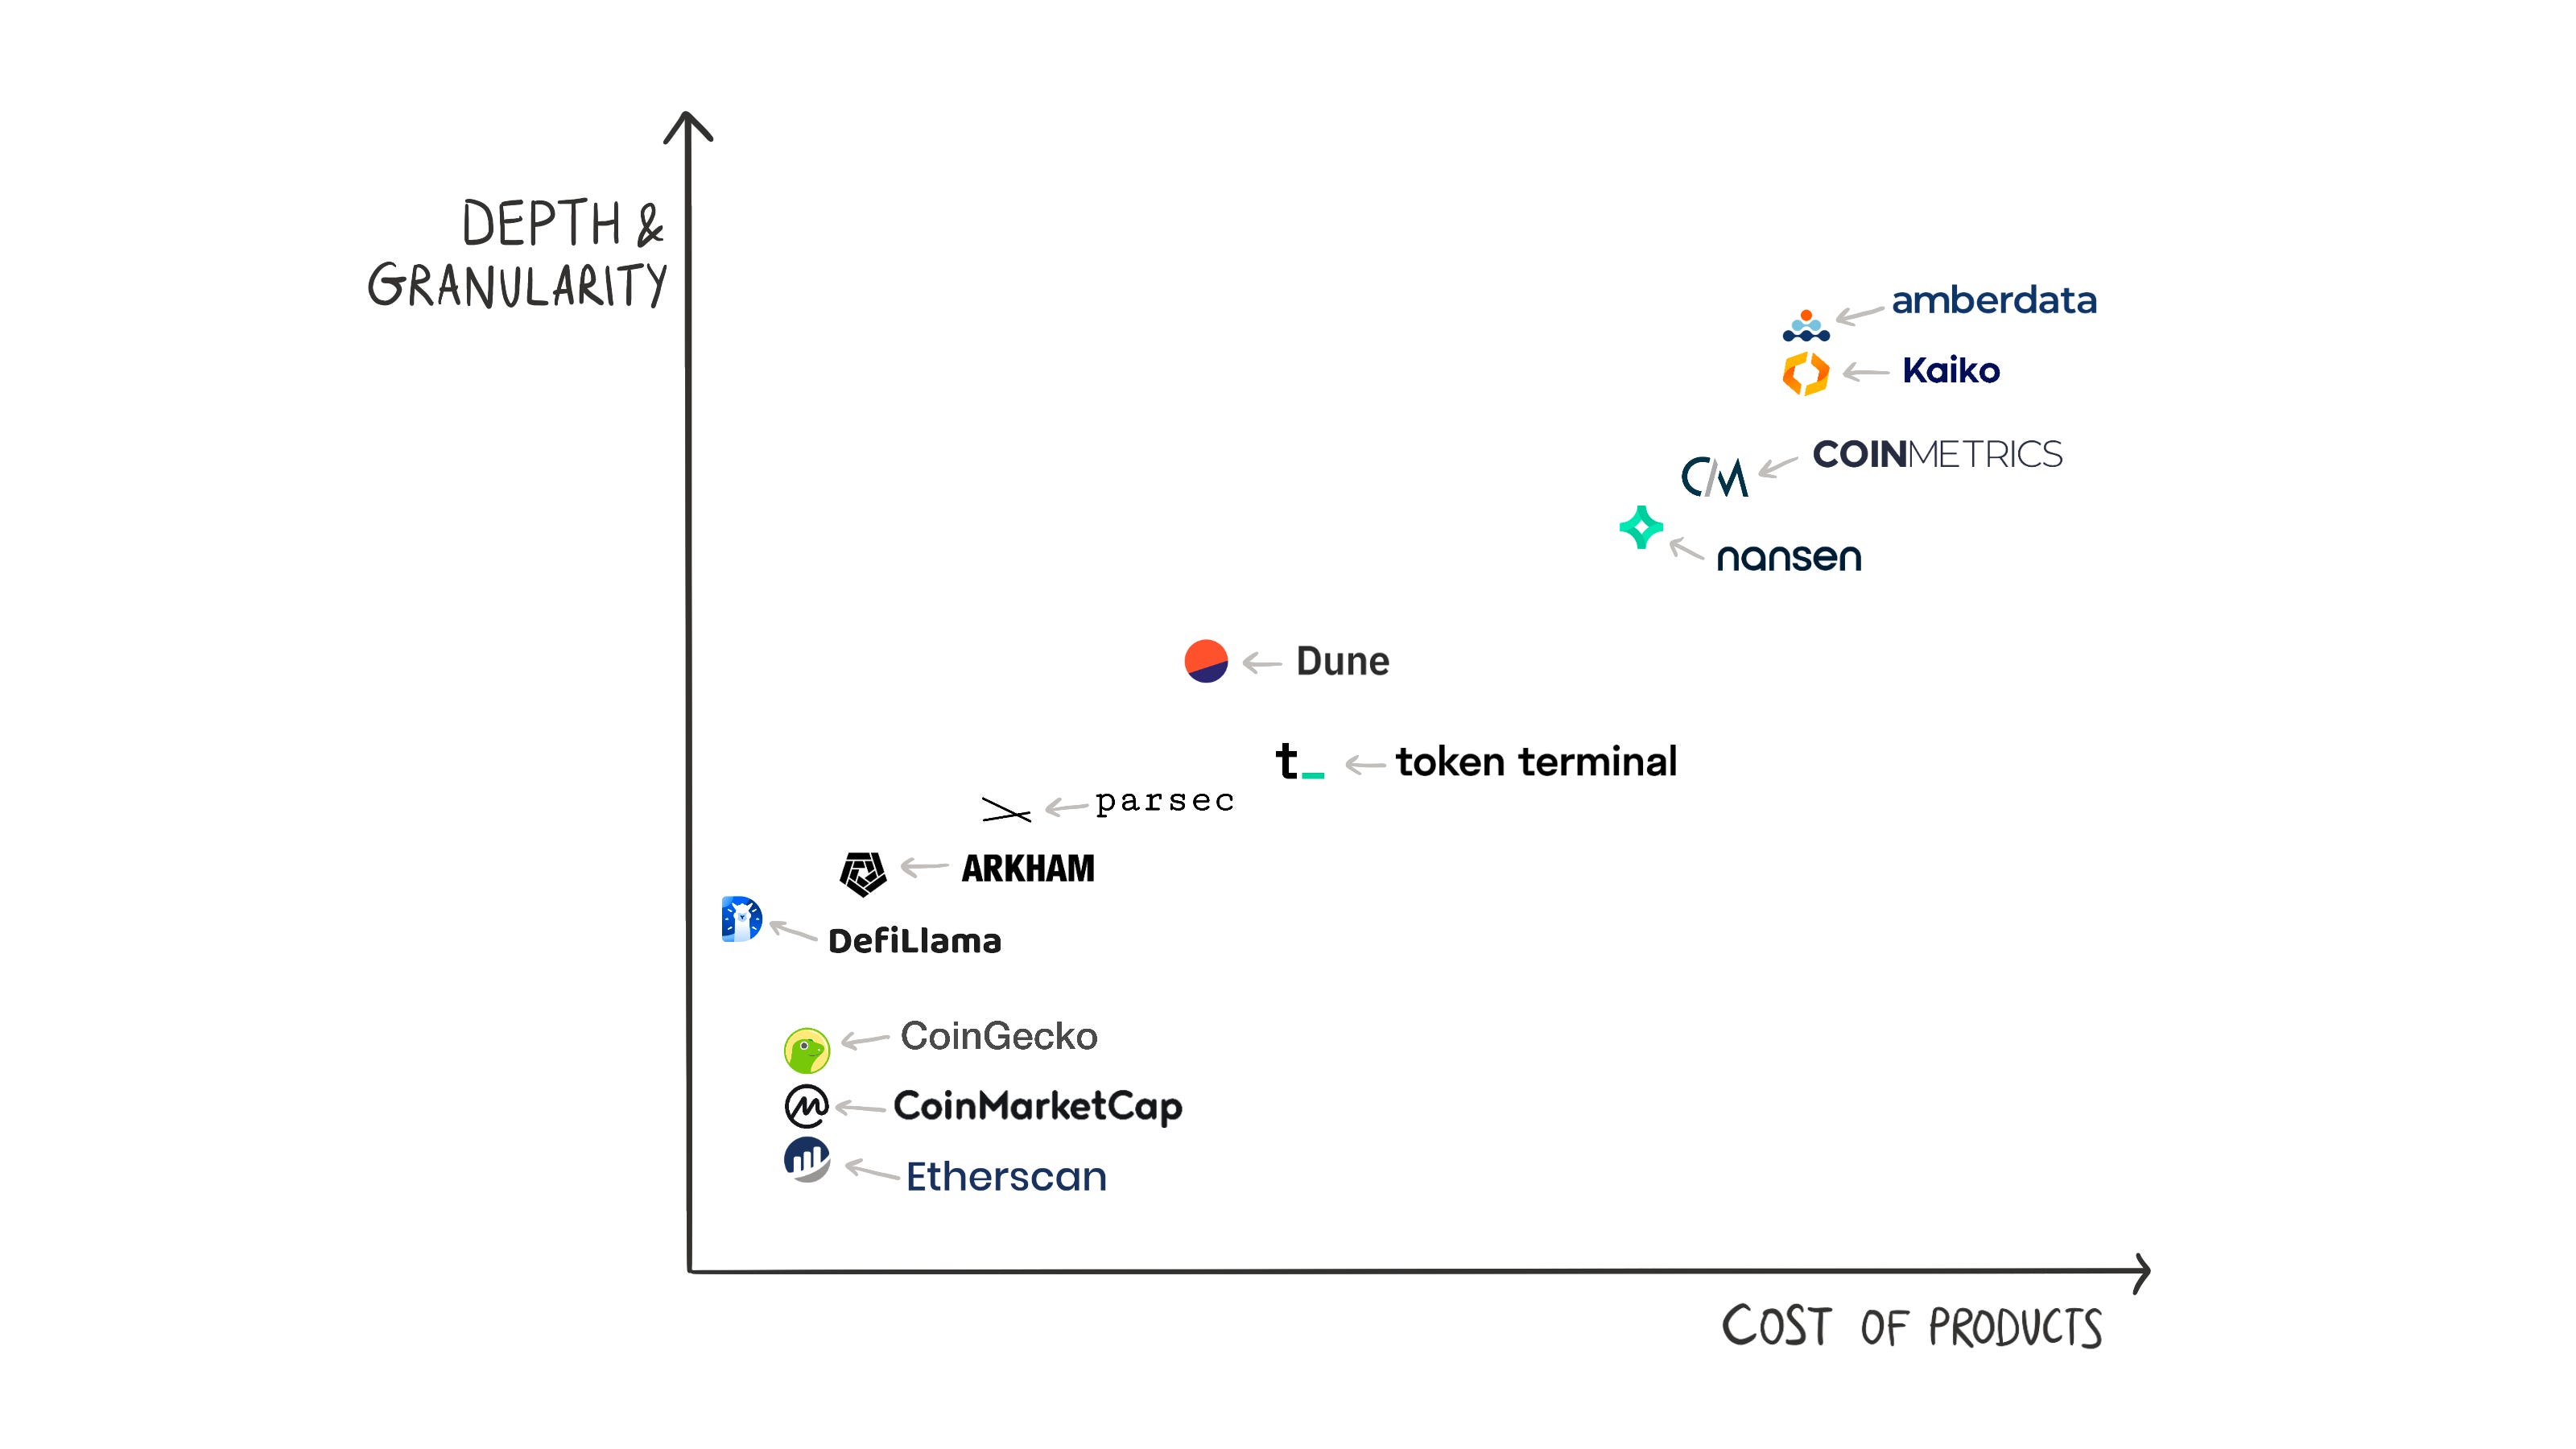
The image above maps different products on two axes – depth and granularity vs. prices of products. Please note that these plots are not exact. A few points may be misplaced. The idea is to develop a mental model to think through several products and their standing in the market.
Retail-focused products like Dune or CoinGecko display almost all the data for free. Customers must pay to access some data or if they want data via APIs for running their analyses. For example, you can view all the charts created by several Dune wizards, but they limit how many rows you can download in CSV form. You can download larger CSV files and view private queries as you pay more.
Retail-focused companies tend to have low revenue per customer and few paying customers as a percentage of free users. Compare this with conversion rates for the freemium models of internet companies. Typically, the conversion rate is 2%–5%. A 10% conversion rate would be an outlier. Their playbook is to have as many free customers as possible so that a 4% conversion rate significantly contributes to the revenue. This is what we call the top of the funnel.
So data companies need the top of the funnel to be large enough to generate enough revenue to sustain themselves at a lower conversion rate. Companies can also consider generating revenue from advertisements when the site has many visitors. CoinGecko uses ad revenue as leverage to keep providing most of the data for free.
Over the years, companies have filled spots on both ends of the (B2B and B2C) spectrum, leaving some gaps in between. If someone wants to see how order books are changing across centralised exchanges or how the put call ratios, IVs, and skews are changing, there aren’t many products that help with visualisations. There is space for a more granular product than the CoinGeckos of the world but less granular than products by pure B2B players.
On Moats
Finding moats in businesses where the raw material is free is not easy. Blockchain data is freely available. There’s nothing proprietary in what data you can gather. So, the moats in data businesses are not just based on you having some data that others don’t. Instead, they are based on a team’s ability to furnish the data in an insightful, consumable format, on time, and without errors.
Many companies claim to have the same data, but the data quality and its presentation differ. For example, many companies claim to have off-chain order book data. However, factors like the number of bid/ask orders, time series length, and the number of available exchanges and pairs differ from provider to provider. Amberdata and Kaiko have the most comprehensive order book data for crypto markets.
Why, though, can only a few providers provide this kind of data? The explanation for where moats emerge in Web3 data lies here.
Talent – At the risk of stating the obvious, when the raw material is free, how you mould it determines the worth of the product. Turning raw data into useful information requires domain expertise in many niches within crypto and traditional financial markets. Teams like Velo Data, with experience in traditional markets, have an edge over others trying to build similar B2C products. Finding talented developers who understand blockchain data structures and have relevant experience in financial markets is rare.
Infrastructure – Collecting and delivering large amounts of data requires infrastructure that doesn’t come easily. This kind of operation requires capital and talent. Why is infrastructure a moat? Think of memory pool data. Blocks contain data for confirmed transactions. What about unconfirmed transactions?
Different network nodes (for example, nodes connected to the same pool) see different unconfirmed transactions. Running just one node will not give a global view of competing transactions. Maintaining multiple nodes on several blockchains adds to infrastructure costs. Much like with AI (and content networks in the past), the ability to keep hardware costs low whilst scaling will determine the winners and losers in the sector over time.
Network Effects –One can hypothesise that network effects exist in many crypto data products. Take Chainlink as an example. It was one of the first oracles that allowed applications to read data from other applications or chains. It managed to garner the community’s support and has one of the strongest communities. Another example is Nansen. Its claim to fame was address labels that allowed it to attribute asset movement to real entities instead of hexanumeric addresses.
Subsequently, it launched features like NFT Paradise and Token God Mode, allowing users to track NFTs and tokens more effectively. Arkham launched a product similar to Nansen’s labels, but investment in dashboards and research allowed Nansen to manoeuvre towards enterprise clients and offer products tailored for them. It is worth mentioning that network effects are not possible without the first two points (talent and infrastructure).
One place this works is with indexers. The higher the number of chains a product supports, the higher the probability that a developer would use the product instead of relying on multiple sources. Teams like Covalent have an edge here as they have been optimising the breadth of chains supported for quite some time. But do remember that depth is as important as breadth.
It is too early to say whether any product has a meaningful moat in crypto. We have witnessed early-mover advantages in the grand scheme of things. As categories like Web3 social and the overlap between AI and crypto continue to scale, data products in the industry may grow to be the next Alphabet. But that will be a multi-decade story; we are still in its early years.
Beyond Speculation
Many of the use cases we mentioned for this article look at financial speculation in some form or another. Even the developers using APIs to query data are building financial products. It may seem odd, but blockchains (as a new network) follow the same trend the Telegraph and the Internet did.
The arrival of a new medium and the emergence of a new network accelerates financial use cases. With the internet, it took until the early 2000s for people to realise that users could be targeted based on their location. With blockchains, we are still figuring out how to build business models off publicly available data trails.
We have seen one key change in our day-to-day use of these platforms – Dune Analytics embedding AI in their product. Dune provides an SQL-based interface for users to query data off blockchains like Ethereum and Solana. The market for such a product is usually restricted to users who understand how to write SQL queries. They recently began using AI to help analysts generate queries without being SQL experts. It is not as functional as one would hope it to be. But it still is a step towards the future. It may not be long before we ask AI (like ChatGPT) to query data off a blockchain and offer its analysis.
One way to think of “data” in the context of Web3 is through the lens of Google Maps. GPS has been around since at least the 1980s. Google put in the work needed to map out the world. In making the overlays for maps available for third-party apps (using APIs), the firm enabled a new generation of applications to be built. Everything from delivery to ride-hailing boomed because a single player specialising in data took on that burden from developers.
Data products in Web3 stand to play a similar role. We don’t yet know the exact nature of applications that could be built atop this publicly available resource, but it is becoming apparent that there is an Alphabet-sized opportunity within the data landscape.
[This article has been written and prepared by Saurabh Deshpande, Siddharth,Joel and published by the GCR Research Team, a group of dedicated professionals with extensive knowledge and expertise in their field. Committed to staying current with industry developments and providing accurate and valuable information, GlobalCoinResearch.com is a trusted source for insightful news, research, and analysis.]
Disclaimer: Investing carries with it inherent risks, including but not limited to technical, operational, and human errors, as well as platform failures. The content provided is purely for educational purposes and should not be considered as financial advice. The authors of this content are not professional or licensed financial advisors and the views expressed are their own and do not represent the opinions of any organization they may be affiliated with.
Leave a Reply
Latest News


More from GCR

Featured GCR Announcement GCR Exclusive GCR Quarterly Review
GCR Market and Investment Trends ...
By Global Coin Research Team Highlights GCR is a research and investment community. As a collective, we source investments, conduct research and diligence, and make ...

The Landscape of Crypto Intents
Introduction The current blockchain paradigm requires users to devise a specific series of transactions to achieve a desired outcome. However, crafting transactions can be complicated. ...

Near AI x HZN – ...
In our last article, we outlined Near’s vision to become the hub for User-Owned AI and the steps that it is taking to develop an ...